Cytopathic effects from viral infections of cells have long been difficult to quantify due to the subjective nature of monitoring cell viability. The advantage of ECIS® technology is the ability to monitor cell behavior (e.g. growth, toxicity, cytopathic effects) quantitatively in real-time and label free. When cells grown on the gold electrodes of ECIS® arrays show changes from viral infections in vitro, their morphology and viability will be detected from the change in impedance measured by the ECIS® instruments.
When detecting cytopathic effects in cell cultures, the researcher needs the ability to monitor cell viability continuously and in real-time. With ECIS® technology, they can do just that. ECIS® technology monitors cell growth and death by the changing impedance that happens well cells attach and spread and then detach from the gold electrodes at the bottom of ECIS® well arrays when viral pathogens are introduced. Through the ECIS software, impedance changes are monitored in graphical form, and when cells attach and spread over the gold electrodes, the impedance rises to confluent levels indicated by a plateau in the graphical plot.
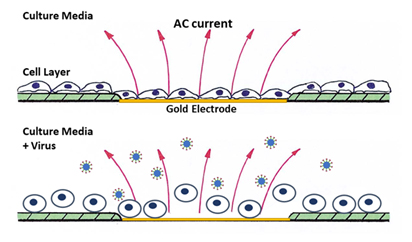
When cells are displaying cytopathic effects following their infection with viruses, the ECIS® instrumentation detects these changes in real time.
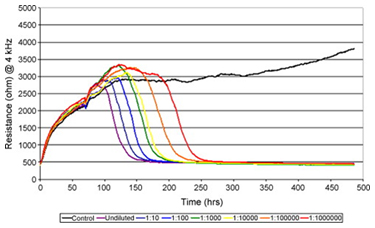
The graph on the left is an example of this, where endothelioma papulosum cyprini cells (EPC) were exposed to infectious hematopoietic necrosis virus (IHNV) in 10-fold dilutions. The graph represents resistance changes that are clearly dependent upon the titer of the virions applied to the cell layers. The black trace is resistance from an uninfected control.
Monitoring viral-induced cell death using electric cell-substrate impedance sensing..,Campbell, Carmen Elaine,Laane, Morten Motzfeldt,Haugarvoll, Erlend,Giaever, Ivar (2007). Biosensors & bioelectronics 23 (4) : 536-542 doi:10.1016/j.bios.2007.06.015 [Abstract]
To view publications in virology please visit our publications page
© 2026 Applied BioPhysics, Inc.
185 Jordan
Road Troy, NY 12180 / Phone: 518-880-6860 / Toll Free: 866-301-ECIS (3247) / Fax: 518-880-6865